


Understanding Online Trout Surveys and Reports
- Jason G. Freund

- May 14, 2023
- 8 min read
Updated: May 15, 2023
There is a lot of fisheries data and publications available online and most anglers do not make use of this quite valuable resource. I will say that the state's do not always make it easy to use their data - but most make some of it available to anglers. And a call or e-mail to your local fisheries biologist is very likely to earn you an informative reply - so long as you understand that there are times of the year where quick replies are nearly impossible.
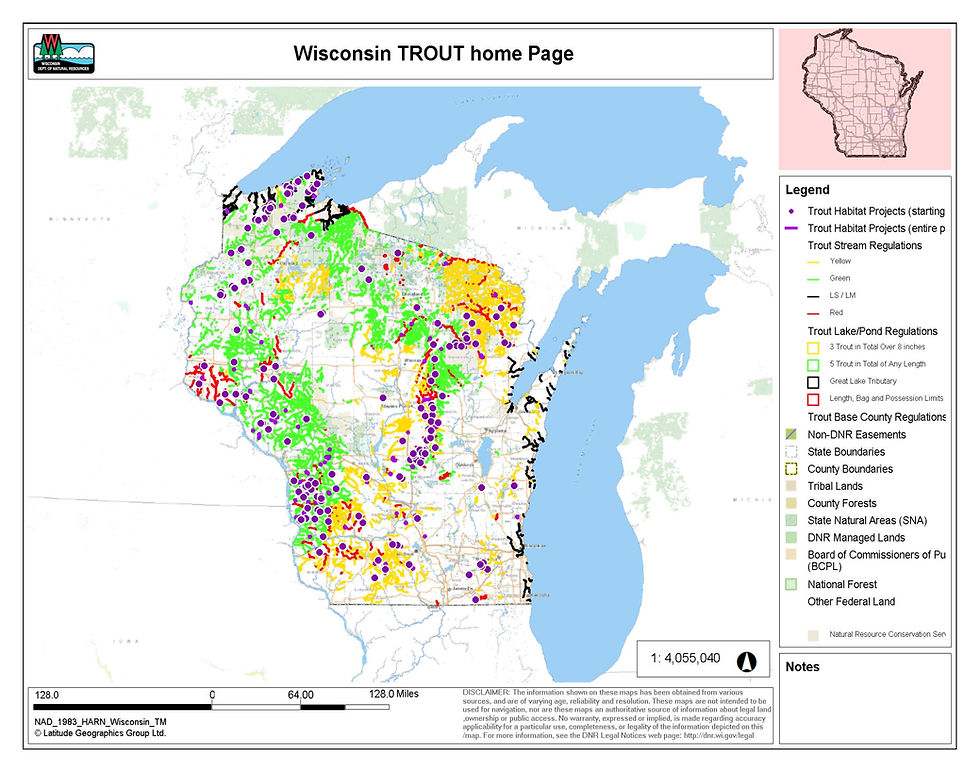
For Wisconsin, the best source of information is from the trout surveys and assessments page on the Wisconsin Department of Natural Resources (WDNR) website but there are other places with information. Fisheries management reports and administrative reports have management reports like creel surveys and how trout stamp funds were spent and where. Many years of technical reports are also available as are peer reviewed publications by year. And there is a link to the Office of Applied Science publications. As you can see, they do not exactly make it simple to find information - but it is out there for those that look. Increasingly, it seem that they are publishing them on the trout surveys and assessments page.
Minnesota's website appears to make their reports a little more readily accessible with a central page that links you to specific topics, like fisheries. Their fisheries research page is a good place to get started and in particular, the links to the Lanesboro and Lake City offices cover much of their Driftless Area.
Understanding Fisheries Data
There is little standardization in how the data are presented though I do know that there is a pretty standardized method of how fishes are collected. Almost all of the data you will see are from single pass electrofishing surveys, most of them specific to collecting trout. When you see IBI (index of biotic integrity) presented, fish collection probably occurred a little differently. This is important because different electrofishing survey methods will provide a bit different results.
There are a ton of ways to explain a population and really no standardized way to present the data. Below are three ways that fisheries data are typically presented.
Population Size and Density is usually presented in the rather odd units of number of trout per mile. I say rather odd because a mile of a stream that averages 3 feet wide is much different than one that average 30 feet in width. However, the measurement make sense to anglers because we often measure our effort by how far we have waded or drifted in a day. Maybe a more transferable density measurement would be a per unit area or volume based measurement - fish per square meter or cubic meter or by acreage. Often what we care about is the population density relative to other streams.
Size Structure refers to the distribution of the sizes of fishes collected. This is the measure that has the most variation in how the data are presented. We often see a simple histogram but that makes comparing among years a little "jumbled". The other option is the line graph below which trades being able to compare across year for the greater information
Fisheries Indices such as relative stock density (RSD) measures, of which preferred stock density (PSD) is probably the most commonly used measure. RSD is a measure of the number of fishes larger than a particular length. Proportional stock density (PSD) is the % (as a whole number) of all the fishes caught larger than stock size (20% of the world record length for that species). I write more about this in the post, What is a Trophy Fish?
Let's look at a few different ways fisheries data are presented.
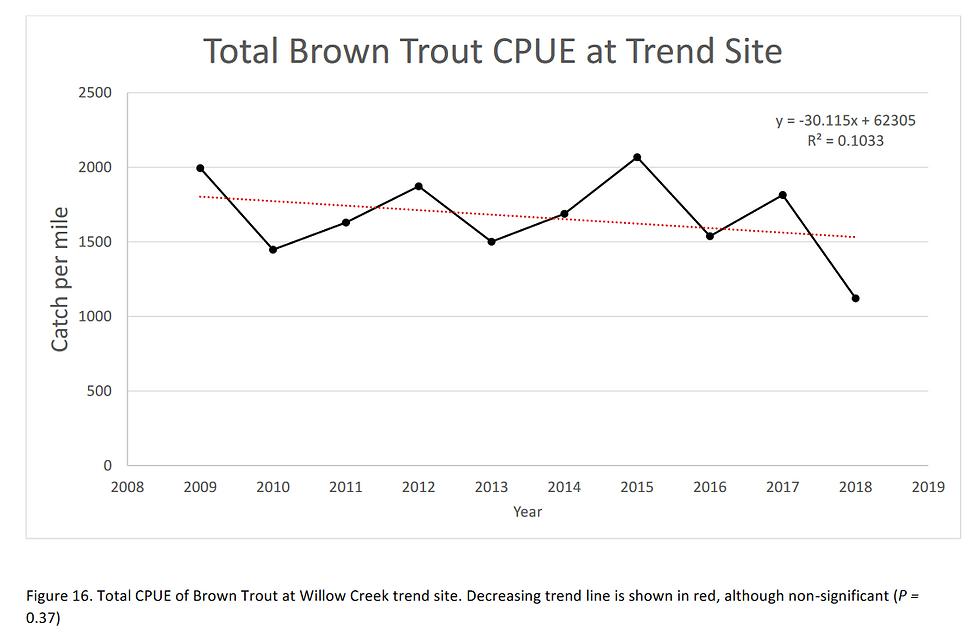
Annual catch per unit effort (CPUE) data from the Willow Creek trend site from the WDNR publication, "Trout Management and Status Report of the Willow Creek Watershed Richland and Sauk Counties, Wisconsin 2018". This might be the simplest and most effective way to see broad patterns such as increases or decreases over time as well as to see how variable the population is. In this case there is a downward trend with a decline of about 30 fish per year (slope) but the line does not fit the data very well, explaining only about 10% of the annual variation (R^2 value). Statistically speaking, there is not a decline because the p-value (0.37) is much greater than the standard alpha value of 0.05 (or the 0.1 we might use in ecological research). This is not surprising given the inherent variability in fisheries data.
This figure also demonstrates another issue with fisheries data - these data are already five years old and 2018 might tell us quite little about 2023.
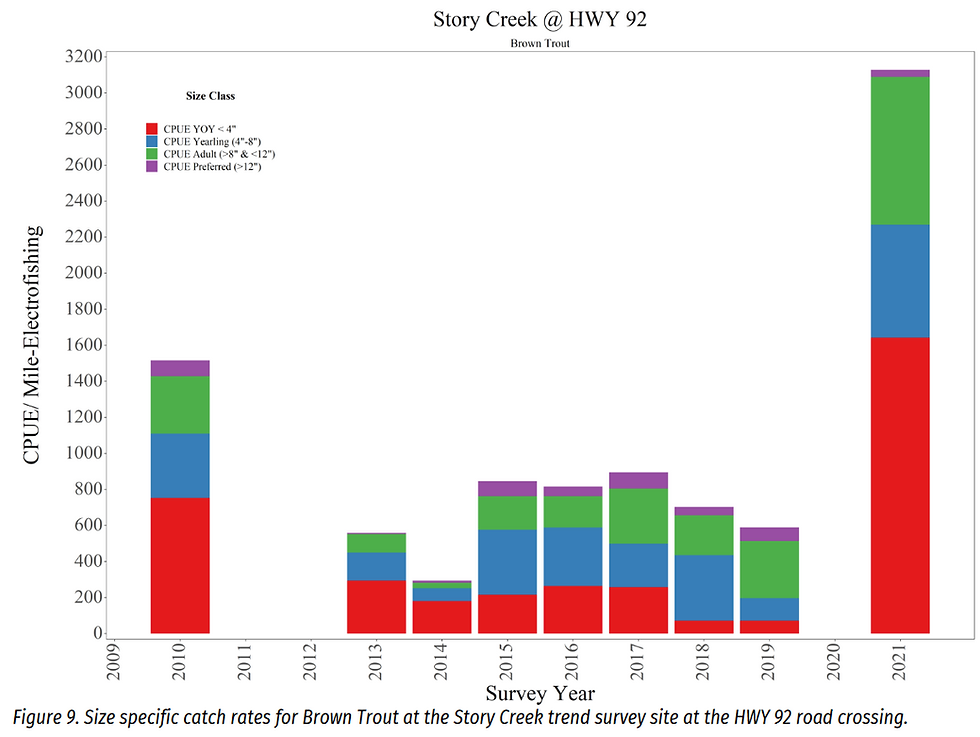
From Wisconsin DNR report, "Trout Stream Management and Status Report of the Sugar River Watershed Dane and Green Counties, Wisconsin 2020-2021". This presentation is essentially the same as the line chart above but adds a bit of information in that it gives more information about the contribution of different size classes of Brown Trout. Do note that YOY (young of the year) have low capture efficiencies (electrofishing is less effective for smaller fishes) and those data are likely to vary much more over time due to the randomness and timing of sampling than does other age class data. In particular, weather and stream flow can have a large impact on fish capture probabilities.
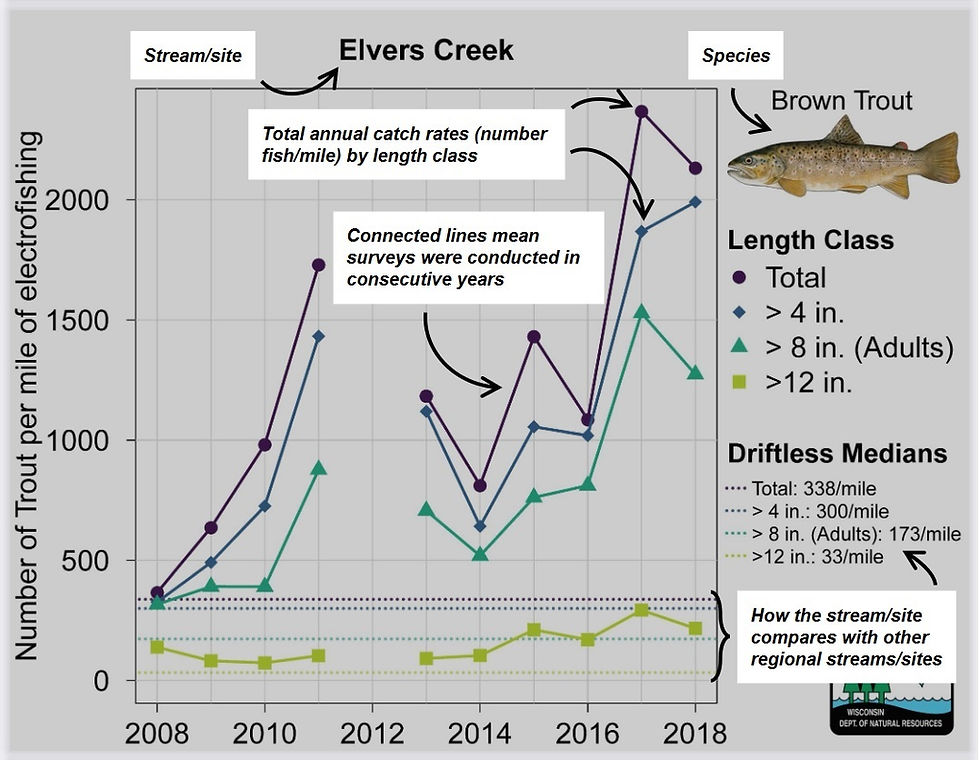
From: Trout abundance and size structure trends in southwest Wisconsin, 2008-2019 [PDF], Wisconsin DNR Trout Surveys and Assessments
The figure above is from the WDNR surveys and meant to orient users to how to read these figures. One important note here is that the top line - the total - is the same as in the other figures. The other lines allow fishes to be included in more than one line. For example, a 13 inch Brown Trout is also included in the greater than 4 (>4 in.) and greater than 8 inch (>8 in.) size classes. That means it is different from the figure above where the bars are additive.
What I do appreciate about the figure above is that their captures are compared to medians for the state and for the Driftless area which helps put the numbers in context. This creek, for example, has a greater abundance of Brown Trout of all sizes classes than do "average" streams statewide and in the Driftless. That is an important piece of information missing from the figures above it.

These data and images are from the report on East Branch Eau Claire River Trend Site (WBIC 1442200) in Langlade County from 2019.
This summary shows a number of useful and important pieces of information - the size distribution as a histogram, the stock density measures, and the fish density over time. There is a lot of information portrayed here. It tells us things like 4.1% of the Brook Trout were over 12 inches and the largest of them were between 13.5 and 14 inches. And the histogram tells us more than just a simple count of the number above or below four inch size groupings. For example, the first peak in the histogram tells us that YOY fishes were mostly 2.5 to 3.5 inches and in year two (often termed a 1+ fish) the peak was around 6 inches. It generally gets more difficult to see year classes after the first two years as fast growing 2+ fish overlap with slow growing 3+ individuals.

Brook Trout data
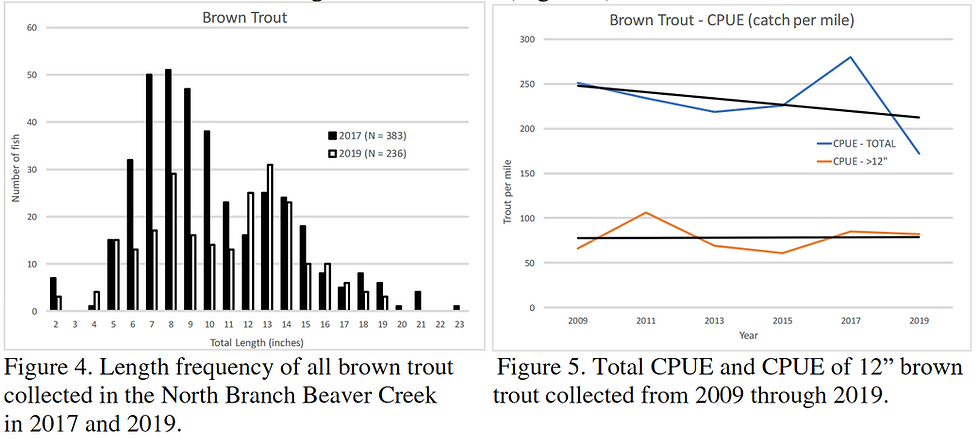
Brown Trout data
Brook and Brown Trout data from the WDNR 2019 report on the North Branch of Beaver Creek, Marinette County shows that there has been a general downward trend over the 11 years presented in the figures. The decline is stronger for Brook Trout than Brown Trout. From these data, I also see things like the fact that there were a number of 20+ inch Brown Trout captured in 2017 but not in 2019. Obviously these data do not provide explanations for why the results are what they are - though the report text begins to provide some context for the data.
The author writes,
Only 12% of the brook trout collected in 2019 were greater than the 8-inch minimum length limit which is comparable to what was observed 4 years ago in 2015 (15% >8”). In 2017,31% of the brook trout were 8 inches or larger (Figure 2).
The author's conclusions are:
The North Branch Beaver Creek supports quality brook and brown trout populations that have been sustained by natural reproduction since 1995. Between 2017 and 2019, there was a noticeable decline in the number of both brook and brown trout collected (Figures 2 and 4). Northeast Wisconsin experienced excessive rainfall throughout the summer of 2019 which contributed to the decline in total CPUE of both brook and brown trout. However, this decline does not indicate that trout populations have changed significantly. These locations will be surveyed again in 2021.
Some of this highlights the variability that is inherent in fisheries data which reduces our ability to draw conclusions that are too strong. It also highlights that while figures are an important way to visualize data, the text of the reports will give a greater context for those results.

Data from 2018 surveys of Lawrence Creek in Marquette County which includes a histogram for Brook Trout and IBI (index of biotic integrity) data and score - which is in the excellent category due to the number of native, coldwater fished present. Lawrence Creek is where Bob Hunt and the WDNR did much of the early work on trout stream improvements and the book "Trout Stream Therapy" took many of its lessons.

Yet another way to depict data - these data are from the WDNR report, "Evaluation of trout population trends and fisheries management in the West Fork Kickapoo River Watershed". What I like about this presentation of data is that it is highly visual and comparisons among sites are readily evident. A report like this one is quite helpful because it presents data in a variety of ways that each tell a piece of the bigger picture. The figure above tell us about the number of trout per mile and the relationship between Brook and Brown Trout. Figures below tell different parts of the larger story.


The figures above all present fisheries data that inform us about different pieces of the bigger picture. Some are specific to the 2018-2020 watershed survey where a greater number of sites than normal were surveyed, others put those survey data in a historic context. Together these seven figures from data from the West Fork Kickapoo watershed tell a larger, more complicated story.
Obviously this extensive watershed survey provides data that annual surveys of specific sites or even smaller watershed are unable to provide. These reports have different goals and required much different efforts to complete. Both are useful in their own ways.
The Wrap Up
These reports can be a useful place for an angler to plan a trip. I generally find them less useful "around home" because I am generally pretty in-tune with the streams near me. Even though the surveys may be a little dated by the time we view them, they can still be pretty useful assuming that there have been no significant changes since the surveys. They are particularly useful when they contain data that 1) show trends over time, and 2) are put in a regional and statewide context.
I wrote this weeks ago - and continued to edit it (half of writing is editing...) - and then a topic came up on the Wisconsin Fly Fishing Message Board that might be of interest on the topic - Wisconsin DNR Trout Streams Booklet.


WI SWIMS DNR database also has some info on surveys and other useful tidbits. You need permission from the DNR to access it though. I got mine when I was helping with a benthic marcoinvertebrate assessment but I think anyone can be granted access.